
Suppose you’re building a model to predict house prices. You give it floor area, train it on a few hundred sales, and get a result that looks suspiciously good. On the training data, practically every prediction lands.
Then you try some houses it hasn’t seen. Apparently a second bathroom can now knock half a million off the price.
Before adding another layer, it helps to ask what went wrong. Did the model miss a real pattern? Or did it get far too attached to the particular houses you showed it?
Those questions lead to bias and variance. The names sound abstract. The mistakes are very familiar.
Start with the target#
Imagine training the same kind of model many times, each time with a fresh sample of data. Ask every fitted model to price the same house. Each purple dot below represents one prediction. The bullseye represents the true average price for those inputs, rather than one noisy sale.
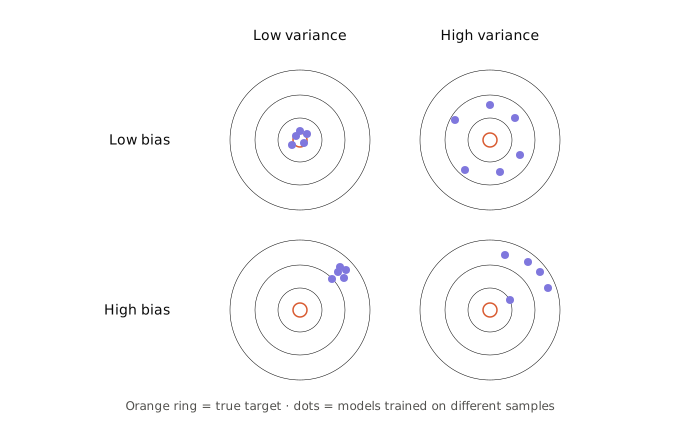
A tight cluster off to one side means the models agree. Unfortunately, they agree on the wrong answer. That’s high bias and low variance.
A wide cloud centred on the bullseye means the predictions average out nicely, but any individual model might be way off. That’s low bias and high variance. “Correct on average” is limited comfort when you only get to deploy one model.
The top-left target is where we’d like to be: close to the truth, without depending too much on the luck of the sample. And yes, you can have both high bias and high variance. They aren’t mutually exclusive personality types.
Bias: the model won’t bend#
Say house prices rise with floor area, but the relationship curves. Our model only knows how to draw a straight line. It will find the best straight line it can. It will still miss the curve.
Give it a million more houses and it can become very certain about that line. The missing bend doesn’t appear by magic. That’s the useful intuition behind high bias: a systematic difference between the average prediction and the true relationship.
An overly simple model is one cause. Heavy regularization can also restrict a model enough to produce underfitting. In practice, missing features or unfinished training can produce similarly disappointing errors, so check those too.
The clue is that the model struggles even on its training data. It hasn’t learned enough of the pattern to do well on examples it has already met.
Variance: the model remembers too much#
Now give a decision tree enough freedom to keep splitting. It might discover that a particular combination of floor area, postcode, and bathroom count identifies one unusually expensive sale.
That helps its training score. Whether it helps price the next house is another matter.
Train the tree on a different sample and those splits may change dramatically. That sensitivity is variance: how much the prediction at a fixed input changes across training sets. It isn’t simply how much house prices vary.
Overfitting often shows up as low training error and much higher validation error. Think of a student who memorized the answer key and is mildly offended that the exam contains new questions.
More representative data often helps here. A pattern supported by three peculiar sales has a harder time surviving contact with three thousand ordinary ones.
The equation earns its keep#
For squared-error regression, we can be precise about this:
This is expected error at a fixed input x, averaging over fresh training sets and a new outcome. The three pieces are squared bias, variance, and noise that remains unpredictable from the available inputs.
Here’s the short derivation. Write the outcome as y = f(x) + ε, where f(x) is the true conditional mean. Assume the new observation’s noise has mean zero, variance σ², and is independent of the training sample. Add and subtract the average fitted prediction:
y − f̂(x) = [f(x) − E[f̂(x)]] + [E[f̂(x)] − f̂(x)] + εSquare it and take expectations. The cross-terms vanish under those assumptions. What’s left is exactly the three terms above. If noise varies with x, use its variance at that x.
The noise term is a useful reality check. Two otherwise similar houses can sell for different amounts because of circumstances your inputs don’t capture. A more elaborate model can’t predict information it doesn’t have. “Irreducible” means relative to the information available; better inputs can change what’s predictable.
Where complexity helps, then hurts#
A more flexible model can capture the bend our straight line missed. It can also chase quirks in the sample. In the classical picture, squared bias falls as complexity increases, variance rises, and their sum plus noise reaches a minimum somewhere in between.
Watch the curves draw below. The black curve is their sum, including a constant noise floor; its lowest point is the best balance for this illustration.
There’s no rule saying the minimum must sit where bias and variance cross. The symmetric example here happens to work out that way. In a real problem, you estimate useful complexity with validation data.
Also, don’t turn the U-shape into a religion. Some modern models show double descent, where test error improves again beyond the point at which the model can fit the training data. Belkin and colleagues’ paper explains why the textbook curve doesn’t cover every regime. “Bigger always overfits” is too neat a story.
Read the errors before changing the model#
Training error tells you how well the model fits what it has seen. Validation error tells you how well that performance travels. Look at both, using the same metric and a meaningful baseline.
| What you see | What to investigate |
|---|---|
| Training and validation errors are both poor | Underfitting, weak features, optimization trouble, or substantial noise |
| Training error is low; validation error is much worse | Overfitting, but also a possible mismatch between the two datasets |
| Both errors are good, with a small gap | A promising fit; check that leakage hasn’t made the task artificially easy |
These are clues, not direct measurements of bias and variance. One train/validation split doesn’t give you the repeated-training experiment from the targets.
For our house model, a random split might also be the wrong test. If deployment means pricing next year’s sales, validate on later sales. A model that recognizes yesterday’s market isn’t automatically ready for tomorrow’s.
What I’d try next#
If the model can’t fit the training signal, check the inputs and training process first. Does it know the location, or are we asking floor area to explain the entire housing market? Then try a more expressive model, useful interactions, or less regularization. More data alone won’t teach a straight line to curve.
If training looks great but validation doesn’t, try stronger regularization, a simpler fit, or more representative examples. Bagging can help unstable models: averaging several trees can reduce the effect of any one tree’s peculiar decisions, especially when their errors aren’t too correlated.
Change something specific, compare validation results, and keep notes. Cross-validation can make that comparison less dependent on a lucky split; it doesn’t itself cure overfitting. Keep a separate test set for the final evaluation rather than consulting it after every experiment.
The question I’d keep coming back to is: does the model need more freedom to learn the pattern, or less freedom to chase the noise?
That won’t solve every bad model. It will give your next experiment a reason to exist beyond “perhaps another layer.”